The most important issues of China (graphs)
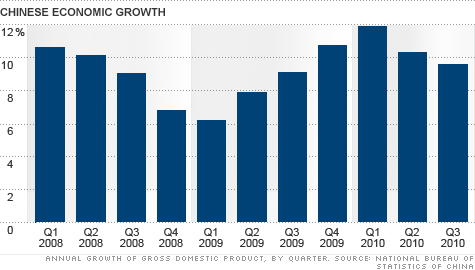
GDP. Level and Evolution
This data is in billions of US dollars ($). We can clearly see a growing trend. The GDP has grown more than the rest of the developed economies of the world although the growht rate is decreasing from 7% to 6,5%. Also, within the components of GDP, we can find that China is focused to increase investment and the domestic demand for products since the financial crisis of 2008 started.

GINI Index Evolution
It is also interesting to see the evolution of Gini index in this country since the crisis began. As we can see in the graph provided below, the GINI index is held within the values of 0.46 and 0.5.
The trend in this graph is a general decrease in the GINI index which means that the income in this country is turning better distributed along the years (as it is now closer to 0).
Nevertheless, the decrease in the value of this number is not very dramatical and it is still very high, what it is telling about the income distribution in this country is that in the middle-class people is not as significant as the poor and rich people in this country.

Evolution of the inflation rate in China since 2008
As shown in the grapgh, the inlfation rate was around 8% in 2008. As the crisis began, there as a case of deflation until 2009, followed by a high rate increase of inflation until the year 2012. From 2012, after a little decrease in the infaltion rate, it is held at 2% until now, being an inflation rate not very high.

Trade Balance evolution
The trade balance is the exports level minus the imports. We can see that the trade balance is positive in all the years, except very few excpeptions in some months.
As it is positive, it means that China exports more than imports. This has a positive impact on the production level of the country, although nowadays, China is more focused on increasing the domestic demand for products, more than in increasing exports level.
This definetely affects the economy because China is one of the countries that exports more products to the rest of the world.


Government expending evolution
The Government expending increases the GDP value of the country. As it is increasing during the years, it is affecting positively the economy. It has grown from 60.000 USD million in 2008 to 200.000 USD million in 2017.

Government Revenues evolution
Here, we can see the government revenues trend from 2008 to 2018. This is formed basically from taxes that must be paid to the government, what will be paid to issues such as health, education ...
As the economy is growing, more taxes and other revenues are necessary to spend in the issues above mentioned. This explains the increase in the government revenues.


Interest Rate evolution
It is important to know how the interest rate has varied along the years because it affects some important issues related to the GDP, like the investment, or the money that is supplied in an economy.
Since the financial crisis began, the interest rate has dropped until 2011, point from which it started to increase until 2012. From 2012 to 2015 it was held constant around the 6% and then it decreased unti the 4,5% in 2016, value in which it is held now.


Wages evolution
We can see that the salaries have increased in nominal terms. Apparently, this means good news, but we also had to see the trend for the salaries in real terms which would tell us the variation in the families can really purchase more products with their salaries or not.
Nevertheless, we can clearly see that the salaries have risen from 29.229 CNY per year in 2008 to 74.318 CNY per year in 2017.


Comentarios
Publicar un comentario